

Connections
Overview
Section titled “Overview”The Connections page is where you connect observability, cloud, and workflow tools so NeuBird can ingest telemetry and run investigations. Connections are shown as a responsive card grid—each card shows the provider icon, name, type, sync status, and optional description. Use Search connections to filter the grid when you have many integrations.
Page controls
Section titled “Page controls”At the top of the page you will find:
- Connections title with a live count of configured integrations
- Search connections (shown when you have at least one connection) to filter by name or type
- Add connection to start the create flow
Each card shows a sync status badge (for example Synced, Syncing, Initial, Insufficient, Incomplete, or Error). If a connection is not fully synced and has a status message, hover the status badge to open a tooltip with the message and a Copy action (synced connections do not show this tooltip even when a message is present).
Creating a Connection
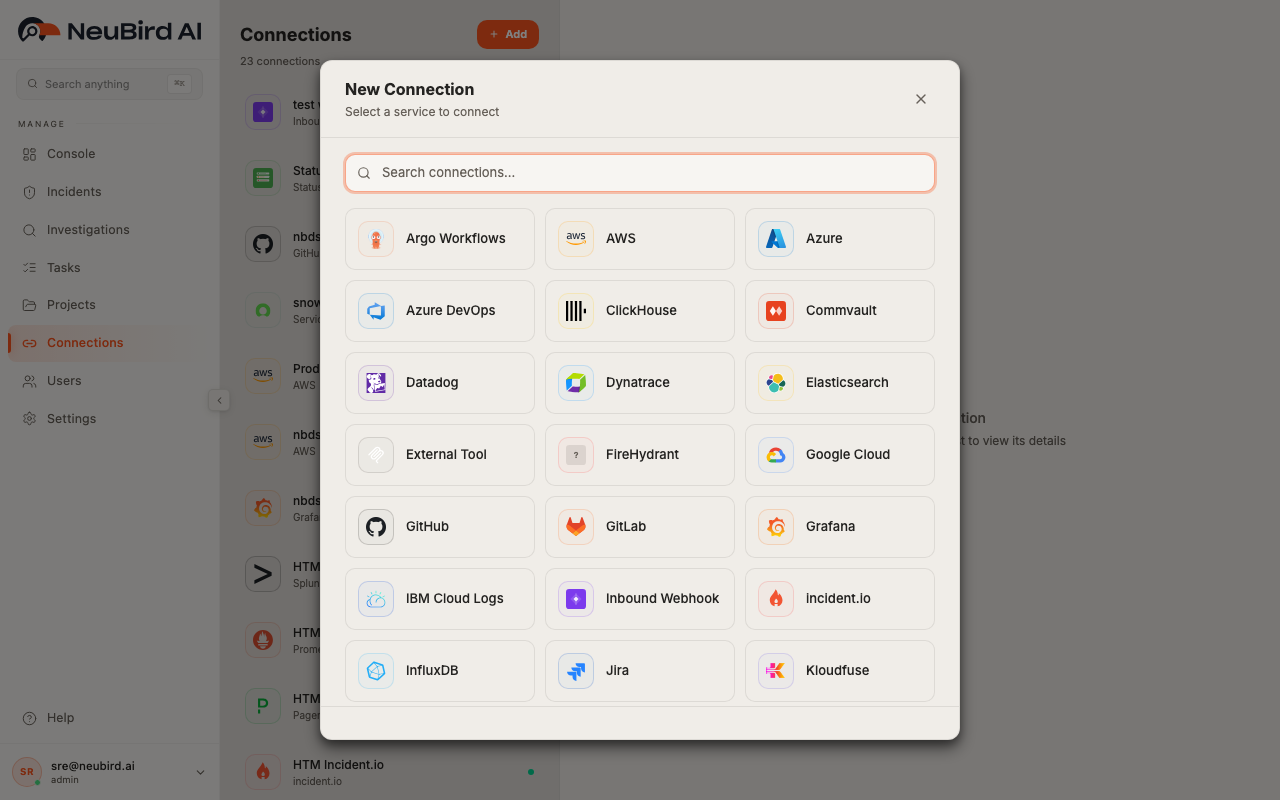
Section titled “Creating a Connection”Click Add connection to open the connection wizard:
- Search or browse categories, then select a provider tile.
- Enter Connection Name and optional Description.
- Complete provider-specific credential fields (tabs, sensitive fields, discovery Load / Refresh, OAuth, region selectors, and similar controls as required).
- Submit with Create Connection.
The provider picker opens on top of the grid (same view as above). Select a tile to continue:
The form may also include:
- Auth mode tabs when a provider supports multiple credential types
- Show/hide controls for secret fields
- View setup guide for inline provider documentation
- A success step with options to add another connection or finish
- A webhook token modal for inbound webhook integrations (copy credentials right after creation)
Editing a Connection
Section titled “Editing a Connection”Open a connection by clicking its card in the grid. The page switches to a split layout:
- Left: the connection grid (or a provider setup guide when you open one from the form)
- Right: the full embedded edit form for that connection
Use Back to all connections in the left header to return to the full-page grid view.
The edit footer provides:
- Delete (left) — removes the connection after confirmation
- Refresh — re-checks sync state with the provider
- Save — applies name, description, and credential changes
There is no separate read-only detail drawer or row menu; the card opens the edit experience directly.
Setup guides
Section titled “Setup guides”While creating or editing, click View setup guide to show authored instructions for that provider in the left panel. General connection guidance is also available from in-app help links.
Managing Connections
Section titled “Managing Connections”- Refresh after credential or scope changes to verify sync status
- Save to update configuration without leaving the page
- Delete when an integration is no longer needed (this affects all projects that use the connection)
- Search and status badges to find connections that need attention
- Read-only access disables Add connection, Save, Delete, and Refresh when your role is viewer-only
Attach connections to projects from Projects setup so investigations and the console can use the right data sources.