Investigations Overview
Investigations are AI-driven analyses where the NeuBird agent examines your infrastructure, identifies root causes, and recommends remediation steps. Each investigation queries your connected telemetry sources — logs, metrics, alerts, traces, and configurations — to build a comprehensive picture of what happened and why.
How investigations are triggered
Section titled “How investigations are triggered”There are three ways to start an investigation:
1. Ask the agent
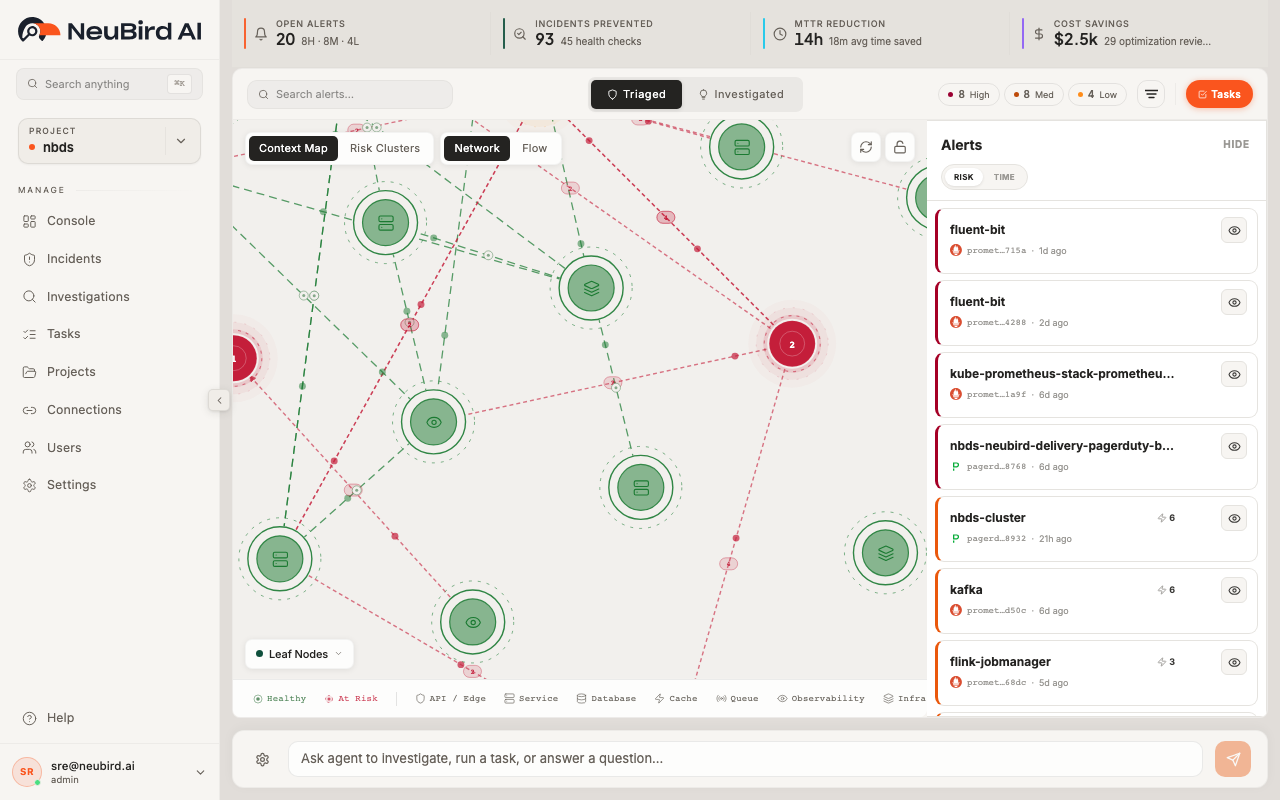
Section titled “1. Ask the agent”From the Console, type a natural-language question into the Ask Agent prompt bar at the bottom of the screen. For example:
- “Why is the message-processor service failing?”
- “Check system health across all services”
- “Investigate the recent spike in API latency”
The agent starts an investigation immediately and you’re taken to the investigation detail page to watch results stream in.
2. From an alert
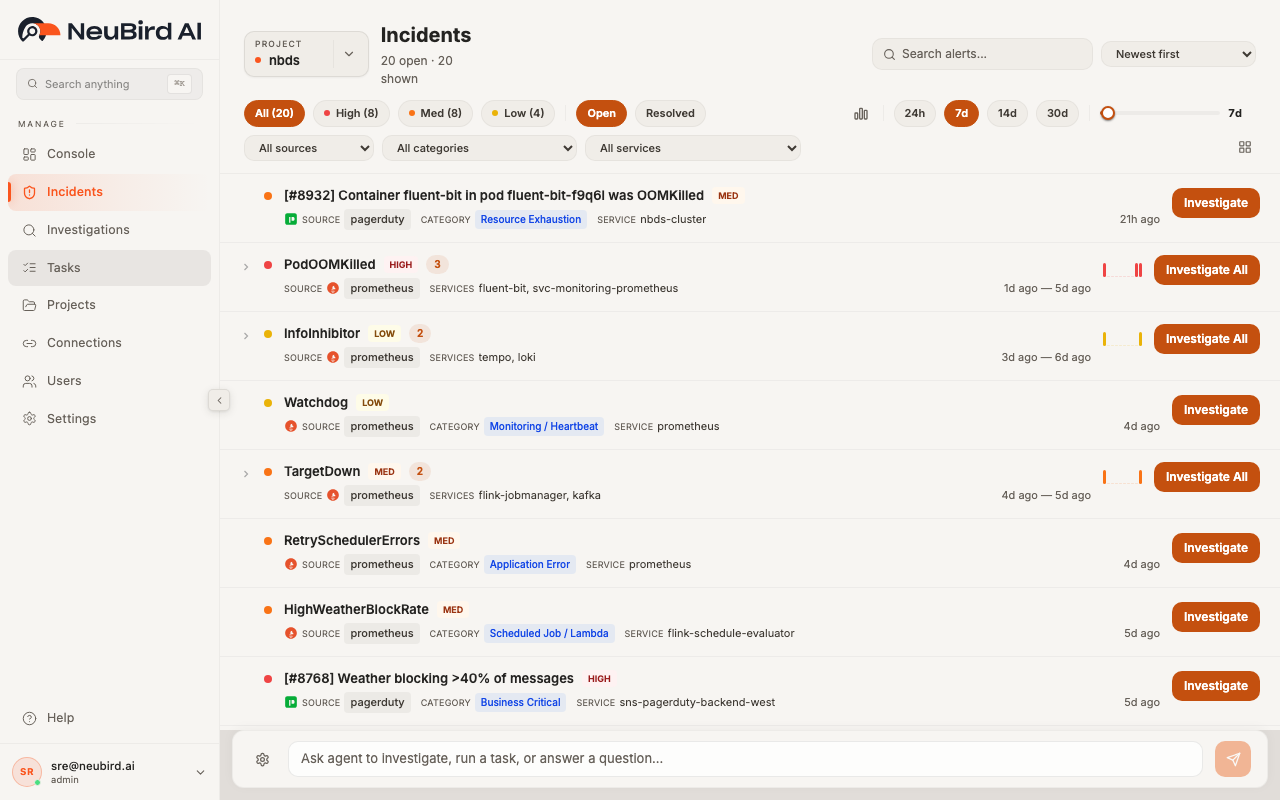
Section titled “2. From an alert”When alerts flow into NeuBird from your connected monitoring sources (PagerDuty, Datadog, Prometheus, CloudWatch, etc.), they appear on the Incidents page. Each alert row has an Investigate button that sends the alert details — including severity, summary, and affected services — to the agent for automated root cause analysis.
For grouped alerts (recurring problems with the same summary), click Investigate All to send the entire cluster in a single investigation.
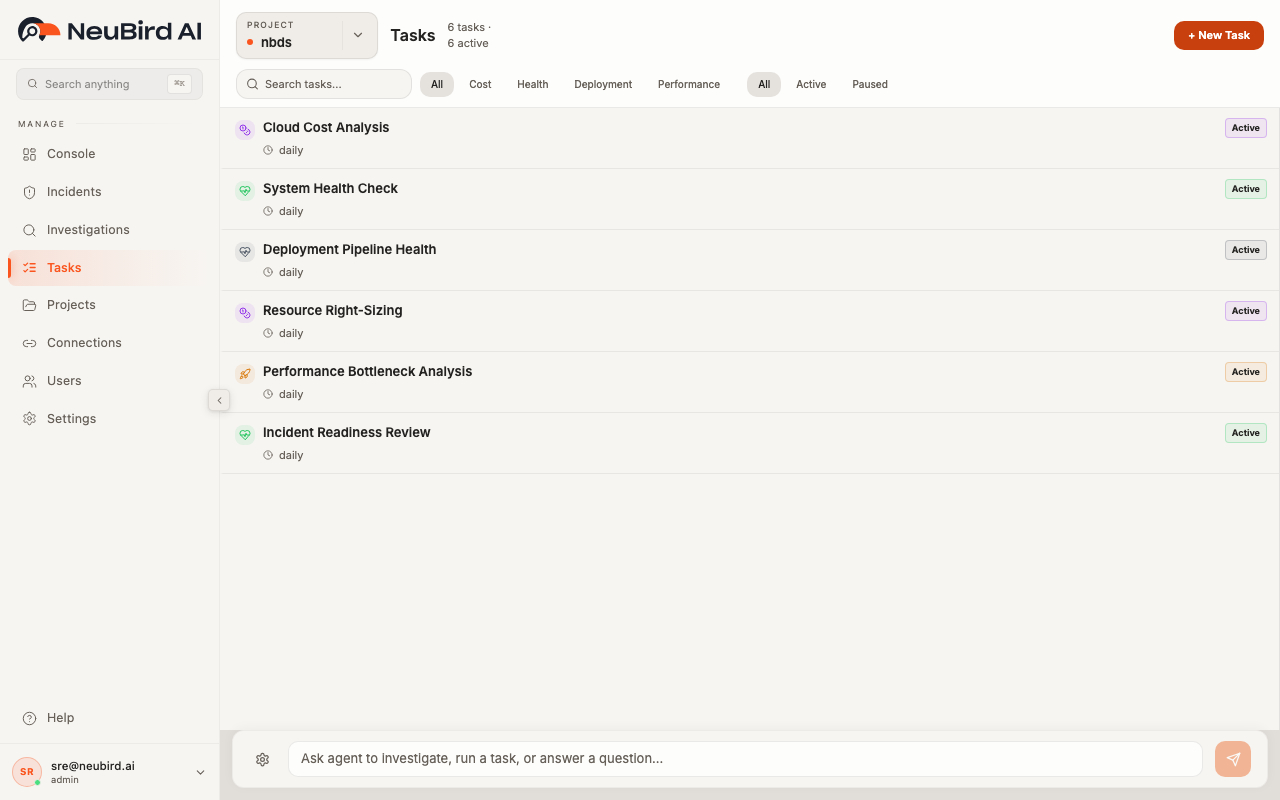
3. From a scheduled task
Section titled “3. From a scheduled task”The Tasks page lets you set up recurring investigations that run on a schedule. Each task defines a prompt that the agent executes automatically — for example, a daily cloud cost analysis or a health check every 6 hours. When a task runs, it creates a new investigation with the task’s prompt.
What happens during an investigation
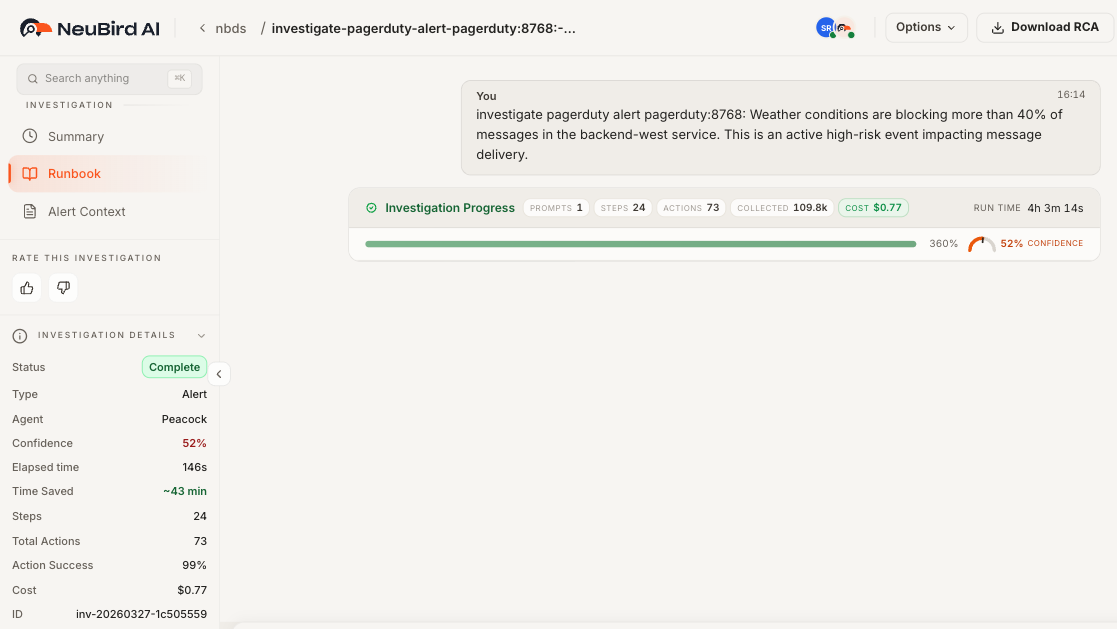
Section titled “What happens during an investigation”Once triggered, the agent works through several phases: exploring, gathering context, investigating, and wrapping up. During each phase it queries your connected data sources, executes tool calls, and builds its analysis incrementally.
You can watch the investigation in real time on the Runbook view, which shows each step the agent takes, the tools it calls, and the data it gathers. The runbook becomes a permanent audit trail once the investigation completes.
Investigation results
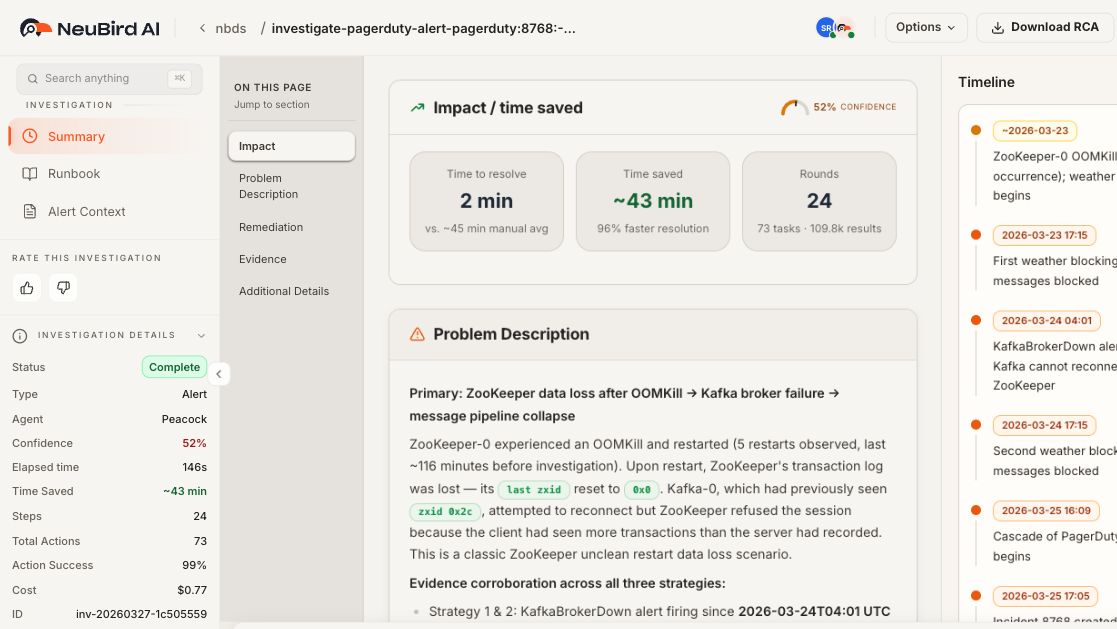
Section titled “Investigation results”When the investigation completes, the Summary view presents the agent’s findings:
- Impact and time saved — how long the investigation took vs. estimated manual triage time, plus a confidence score
- Problem description — a narrative of what happened, with supporting evidence
- Risk-tiered findings — issues organized by severity (High, Medium, Low)
- Remediation steps — concrete actions prioritized as Immediate, Short-term, and Long-term
- Evidence table — the raw data points the agent used, with sources and significance
- Timeline — chronological events in a sidebar
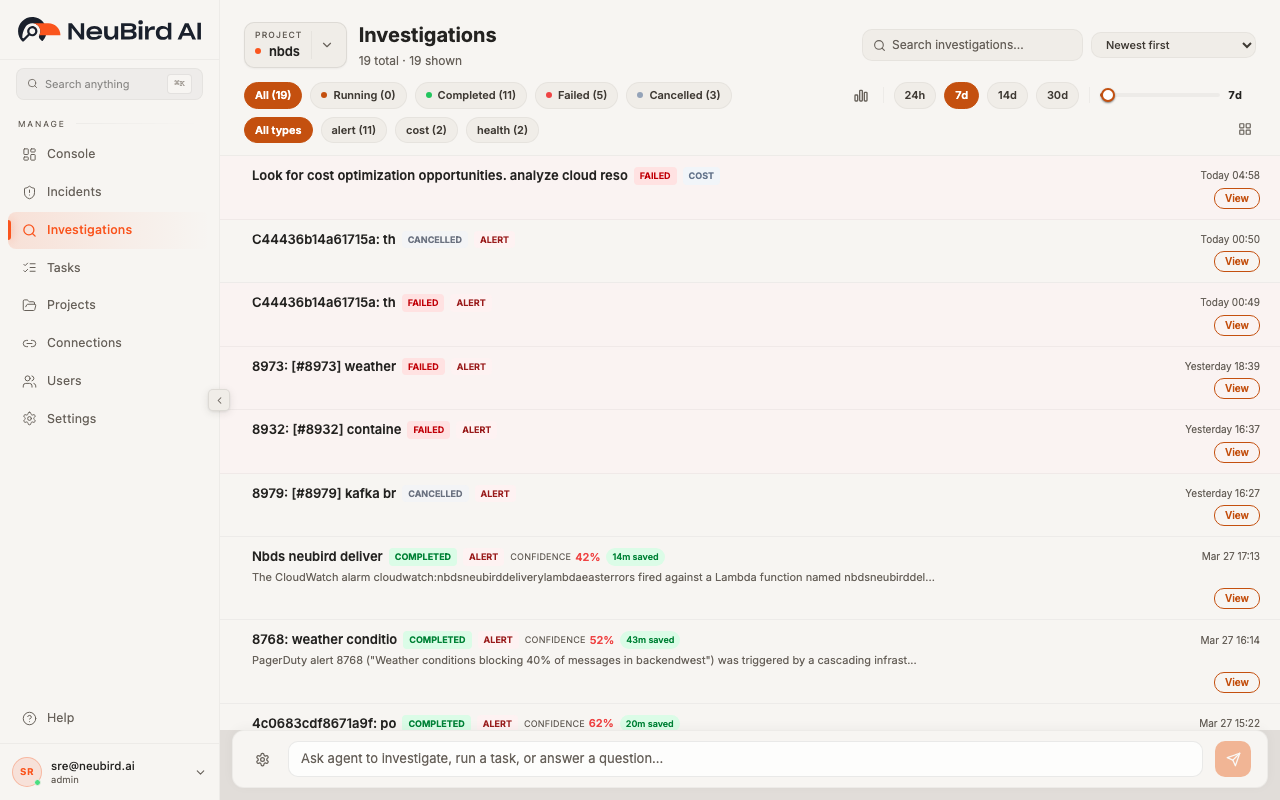
Browsing past investigations
Section titled “Browsing past investigations”The Investigations page shows every investigation the agent has run for your project. Each row shows the investigation title, status, type (Alert, Question, or Task), confidence score, and time saved. You can filter by status, type, and time range, or search by keyword.