

Prometheus
Connecting NeuBird to your Prometheus instance enables collection of metrics telemetry for real-time monitoring of key performance indicators and resource utilization.
Prerequisites
Section titled “Prerequisites”-
Running Prometheus instance — If you don’t have one, follow the official setup guide.
-
API accessibility — Verify the Prometheus API is reachable:
Terminal window curl http://<prometheus-server>:9090/api/v1/targets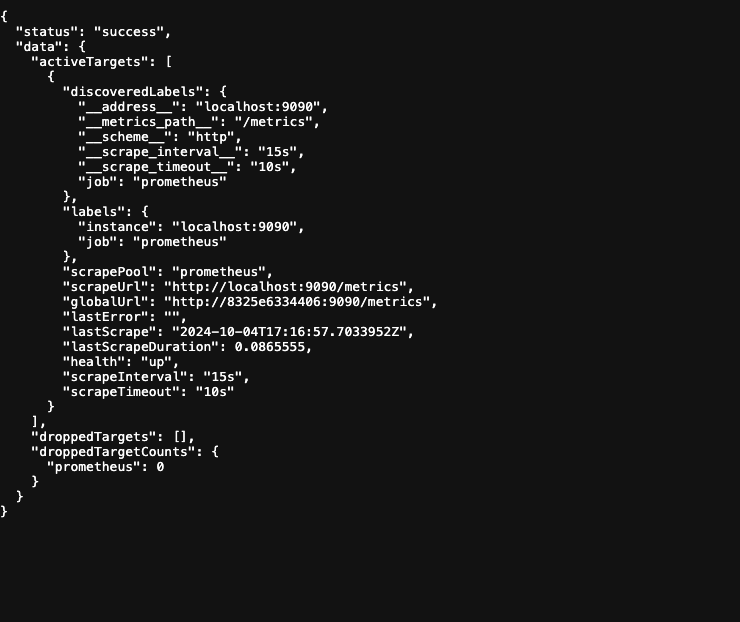
This should return a list of targets being monitored. If the API is not accessible from the internet, you may need to configure network access or use Teleport for private endpoints.
-
Gather your URL — You’ll need the Prometheus server URL, e.g.
http://<prometheus-server>:9090.
Connection Fields
Section titled “Connection Fields”| Field | Required | Description |
|---|---|---|
| Name | Yes | A descriptive name for this connection |
| Description | No | Optional note about what this connection is for |
| URL | Yes | Prometheus server URL, e.g. http://<prometheus-server>:9090 |
For general instructions on creating and managing connections, see the Connections Overview.