

Console
Overview
Section titled “Overview”The Console is your main operations workspace. It combines live health metrics, a service map, alert triage, and investigation history so you can move from detection to investigation without leaving one page.
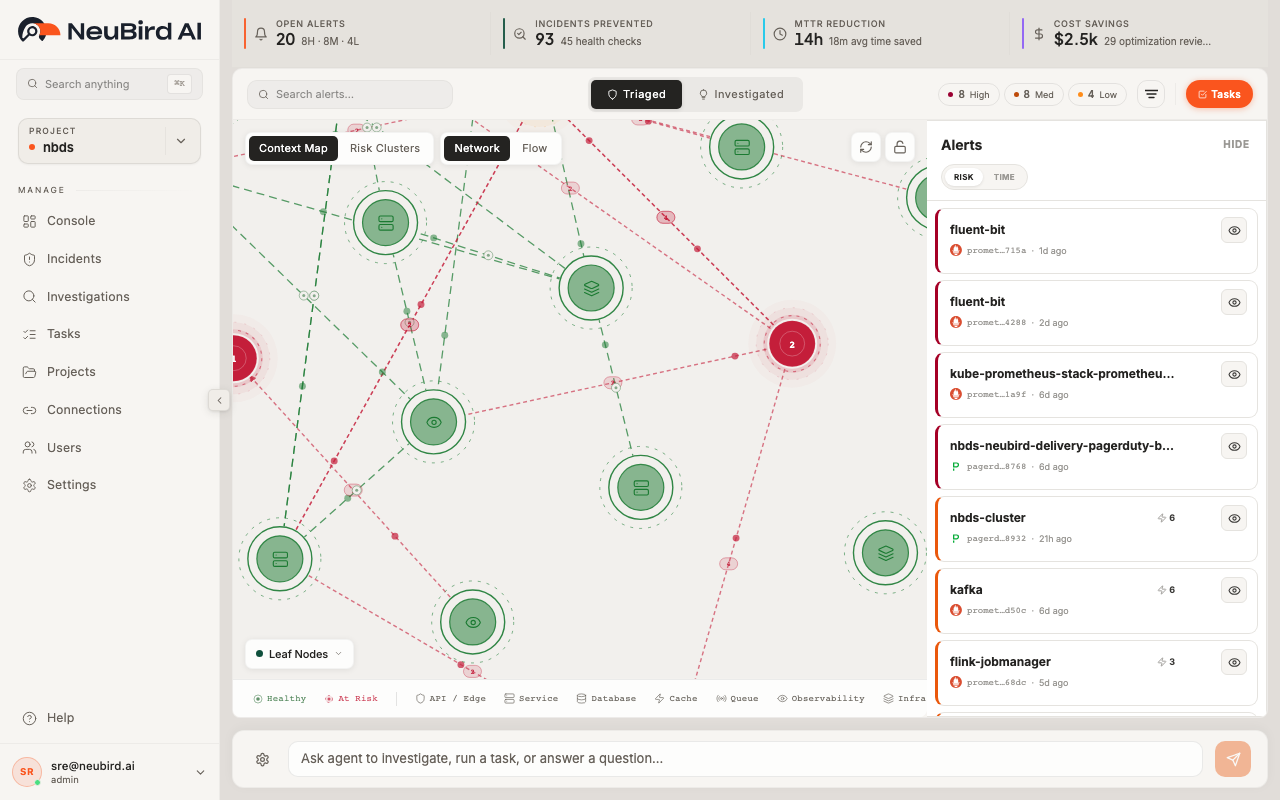
At the top of the workspace, you can switch between Triaged and Investigated views (and Agents when enabled), search by text or tags, apply source/risk filters, and set the time scope.
Dashboard Metrics
Section titled “Dashboard Metrics”The metrics strip gives you a quick operational snapshot:
- Open Alerts tracks unresolved alerts with severity context.
- Investigations summarizes investigation volume and investigated alert count.
- MTTR Reduction estimates time saved through automated investigations.
- Agent Confidence shows the model’s current confidence trend.
Use this row to decide whether to focus on triage (new risk) or investigation follow-through.
Service Map
Section titled “Service Map”The center panel shows your service map and dependency relationships.
You can control the map with the action buttons in the top-right of the map area:
- Expand map and Show alerts panel let you focus on map-only or split-pane workflows.
- Reset view clears map selections/highlights and recenters the visualization.
- Lock/Unlock zoom helps prevent accidental panning/zooming during review.
- Tier selector (when available) lets you move between topology tiers.
When you select a node or group, the right rail updates to matching alerts so you can investigate impact without re-filtering manually.
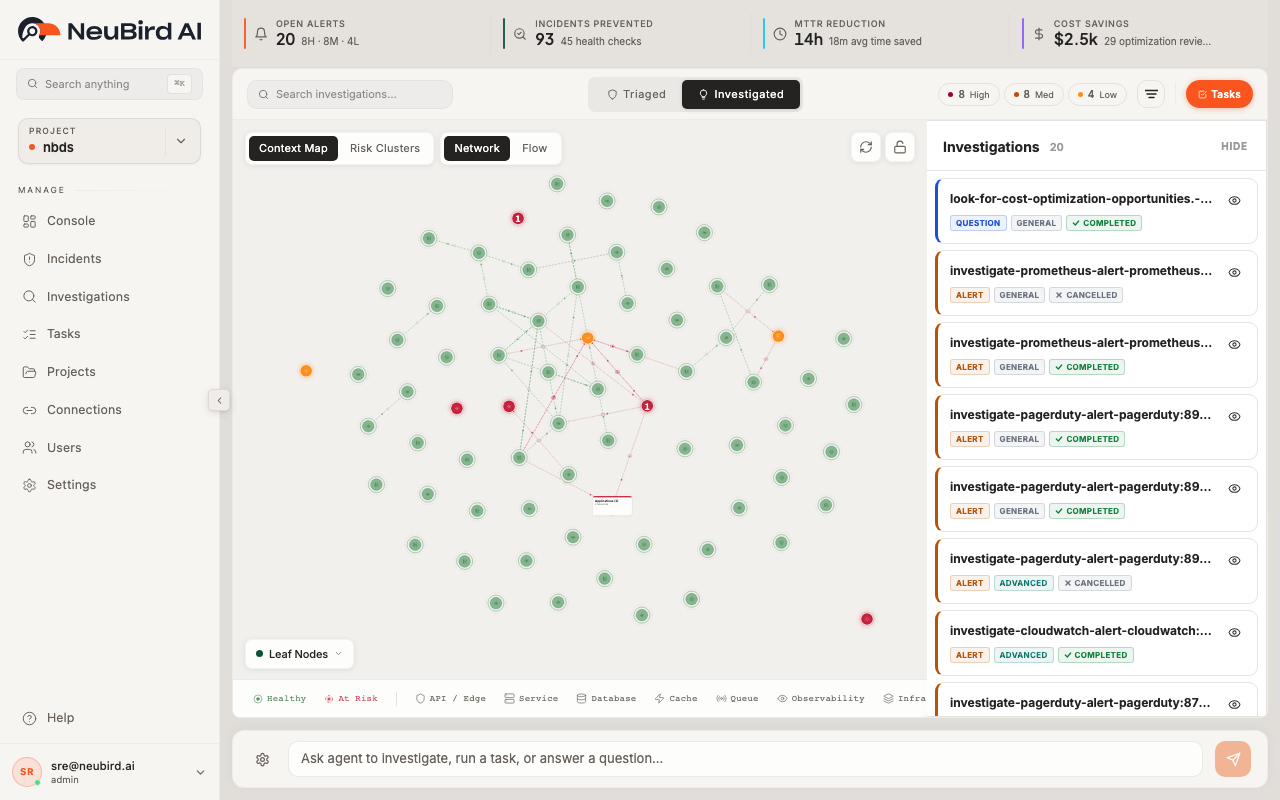
Incident Triage
Section titled “Incident Triage”Use Triaged for active alert triage and Investigated for completed/in-progress investigations.

In this area, you can:
- Search quickly with free text plus tag helpers (for example, service/namespace in triage mode).
- Open advanced filters from the funnel icon, then narrow by Source.
- Apply risk pills (High, Med, Low) and cluster filters where enabled.
- Click Reset to clear search and filter state in one action.
Time Scope
Section titled “Time Scope”Use the Days control in the filter bar to limit the console to a specific time window:
- Drag the range handles to choose start/end days.
- Click the refresh/apply button to run the new range.
- Optionally open the popover to set exact start/end date-time and timezone.
This is useful when you want to focus on only recent regressions or a specific incident window.
Asking the Agent
Section titled “Asking the Agent”Use Ask Agent to start a new natural-language investigation directly from the Console.
Ask focused questions like:
- “Why did checkout latency spike in the last hour?”
- “Investigate high-risk alerts for payments service.”
- “Summarize current system health and likely root causes.”
After you submit, the UI opens the investigation flow so you can watch progress, reasoning rounds, and outputs in detail.
Tasks (Quick Access)
Section titled “Tasks (Quick Access)”Use Tasks for quick task runs from the Console without navigating away from active triage.
From quick access, you can launch existing scheduled tasks on demand. For full task lifecycle management (create, edit, schedule, archive, run history), use the dedicated Tasks page from the sidebar.