

Incidents
Overview
Section titled “Overview”The Incidents page gives you a single view of every alert flowing into NeuBird from your connected monitoring sources — PagerDuty, Prometheus, Datadog, CloudWatch, Grafana, and others. Alerts are automatically grouped when they share the same summary, so recurring problems surface as a single row with an occurrence count instead of cluttering the list. From here you can filter, search, inspect details, and launch AI-powered investigations with one click.
Viewing Incidents
Section titled “Viewing Incidents”The page header shows the selected Project, the total number of open (or resolved) alerts, and how many are currently visible after your filters are applied.
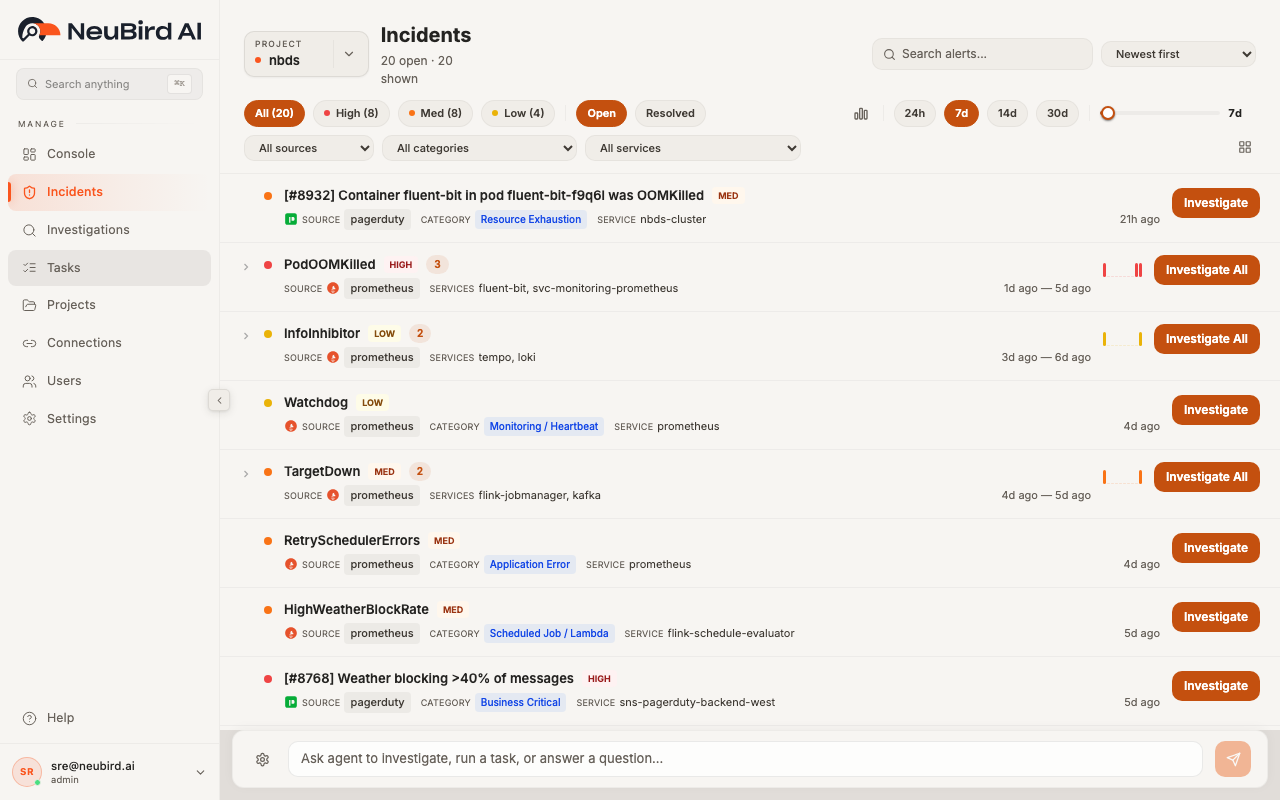
Each row in the list displays:
- Severity dot — a colored indicator (red for High, orange for Medium, yellow for Low) at the start of the row
- Alert title — the summary text from the source system, with a severity badge beside it
- Source — the monitoring platform that generated the alert (shown with a colored icon)
- Category — an optional classification tag such as “Resource Exhaustion” or “Application Error”
- Services — the infrastructure components affected by the alert
- Timestamp — relative time since the alert was created (e.g., “21h ago”, “4d ago”)
When multiple alerts share the same summary, they are collapsed into a grouped row. The group shows an occurrence count badge, a mini sparkline of alert frequency over the time range, and the services affected across all occurrences. Click the chevron to expand the group and see each individual alert. If a group contains more than ten alerts, click Show all at the bottom of the expanded list to reveal the rest.
Click any row to open the Alert Detail Panel on the right side of the page. The detail panel shows the full alert payload and lets you click a service name to filter the list down to that service.
You can toggle which metadata columns appear in the list by clicking the grid icon in the filter bar. A dropdown lets you show or hide Source, Category, and Services columns.
Severity and Risk Scoring
Section titled “Severity and Risk Scoring”NeuBird normalizes severity from every connected source into three levels:
- High — critical or high-severity alerts that typically require immediate action
- Med — medium-severity alerts that may need attention soon
- Low — informational or low-priority alerts
The severity pill buttons at the top of the page show the count for each level. Severity is derived from the alert’s impact_risk or severity_normalized field, so the label you see reflects the original source classification mapped into NeuBird’s three-tier model.
Filtering and Search
Section titled “Filtering and Search”You have several ways to narrow down the alert list:
Severity pills
Section titled “Severity pills”Click All, High, Med, or Low to filter by severity. Each pill shows the current count so you can see the distribution at a glance.
Open / Resolved
Section titled “Open / Resolved”Toggle between Open (active, unresolved alerts) and Resolved (alerts that have been closed or acknowledged).
Dropdown filters
Section titled “Dropdown filters”Three dropdown menus let you filter by:
- All sources — restrict to a single monitoring source (e.g., only PagerDuty alerts)
- All categories — restrict to a specific alert category
- All services — restrict to alerts affecting a particular service
Search
Section titled “Search”Type in the Search alerts field to do a full-text search across the alert title, source, category, and service names. Click the X button to clear the search.
Sort order
Section titled “Sort order”Use the sort dropdown (top right) to reorder the list:
- Newest first (default) — most recent alerts at the top
- Oldest first — oldest alerts at the top
- Severity: High to Low — critical alerts first, then medium, then low
- Severity: Low to High — the reverse
Time range
Section titled “Time range”Control how far back the list reaches using the time preset pills (24h, 7d, 14d, 30d) or drag the lookback slider to set a custom window. In 24h mode the slider moves in hours; for longer ranges it moves in days up to 90d.
Click the histogram icon to open the Alert Timeline modal, which shows a bar chart of alert volume over time. You can brush-select a specific time range on the histogram and click Apply to zoom the incidents list into that window. A custom time range badge appears in the filter bar; click the X on the badge to clear it and return to the default range.
Clearing filters
Section titled “Clearing filters”When any filter is active, a Clear all link appears in the filter bar. Click it to reset every filter, search term, and time range back to defaults.
Triggering Investigations
Section titled “Triggering Investigations”Every alert row has an Investigate button. Click it to send the alert details — including severity, summary, and affected services — to the NeuBird AI agent, which starts an automated root cause investigation immediately. You are redirected to the investigation detail page to watch results stream in.
For grouped alerts, click Investigate All to send the entire cluster to the agent in a single investigation. The prompt includes the number of related alerts, the shared summary, all affected services, and the time range of occurrences, giving the agent full context to correlate the recurring issue.
While an investigation is being submitted, the button is disabled to prevent duplicate requests.