Investigation Summary
Overview
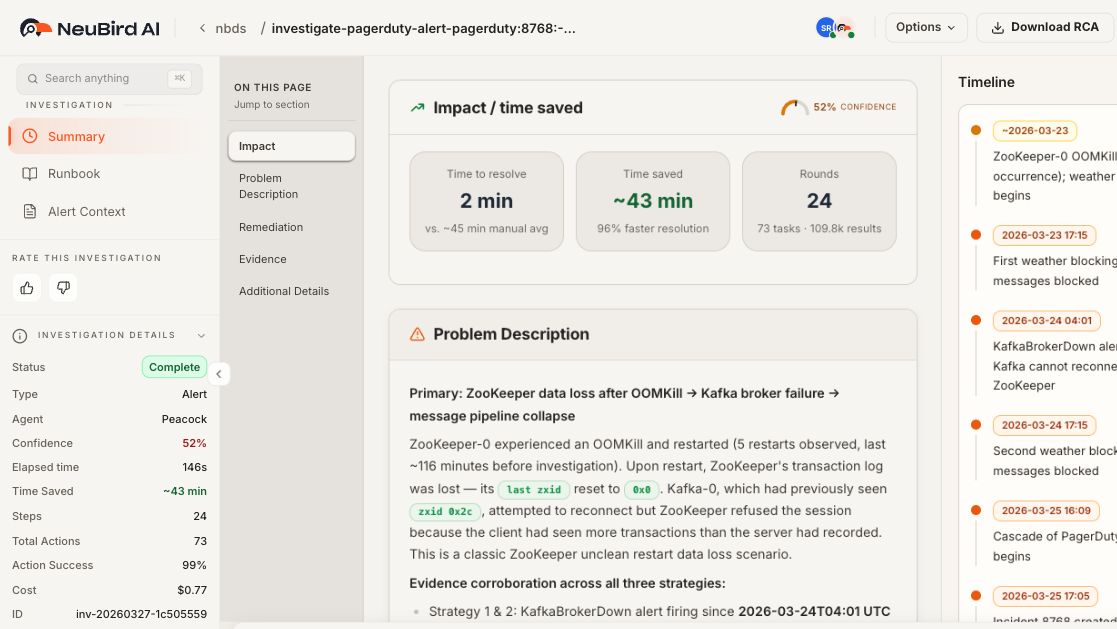
Section titled “Overview”The Summary view is the primary report for a completed investigation. It presents the agent’s root cause analysis, impact assessment, and recommended next steps in a structured, scrollable layout. An On this page navigation rail on the left lets you jump between sections quickly, and a Timeline sidebar on the right shows chronological events with timestamps.
Investigation Progress
Section titled “Investigation Progress”While the investigation is running, a progress header shows the current phase, confidence level, and elapsed time. The phase advances through exploring, gathering context, investigating, and wrapping up as the agent makes progress. Once the investigation completes, the progress header is replaced by the Impact / time saved card described below.
Impact / Time Saved
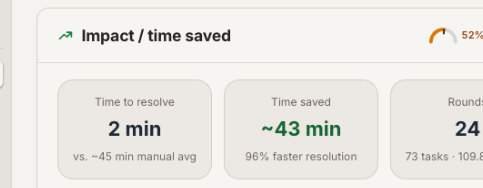
Section titled “Impact / Time Saved”The Impact / time saved card appears at the top of the summary once the investigation completes. It contains three metric tiles and a confidence gauge:
- Time to resolve — the actual resolution time (e.g., 2 min) compared to the estimated manual average (e.g., vs. ~45 min manual avg).
- Time saved — the difference between manual and automated resolution, shown as an absolute value and a percentage (e.g., ~43 min, 96% faster resolution).
- Rounds — the number of reasoning rounds the agent completed, along with the total tasks executed and results processed (e.g., 24 rounds, 73 tasks, 109.8k results).
A confidence gauge in the card header displays the agent’s overall confidence as a semicircular arc with a needle and percentage label.
Confidence Score
Section titled “Confidence Score”The Confidence Score reflects how certain the agent is in its findings. It is derived from the quality and consistency of evidence gathered across multiple data sources during the investigation. A higher score means the agent found strong corroboration from independent sources. The confidence is displayed as the gauge in the Impact / time saved card header, showing a percentage and a color-coded arc (green for high, amber for moderate, red for low).
Time Saved
Section titled “Time Saved”The Time Saved metric estimates how much time the automated investigation saved compared to manual triage. It is calculated from the complexity of data sources queried, the number of tool calls executed, and the depth of analysis performed. The metric tile shows both the absolute time saved and the percentage improvement over the manual average.
Risk Tiers
Section titled “Risk Tiers”Findings in the summary are organized by risk tier, each rendered as a color-coded card:
- High Risk — red-accented card for critical issues that need immediate attention and have strong evidence.
- Medium Risk — amber-accented card for issues that should be addressed soon but are not immediately critical.
- Low Risk — neutral-accented card for informational findings unlikely to cause immediate problems.
Each tier card has a warning icon and colored header so you can prioritize at a glance.
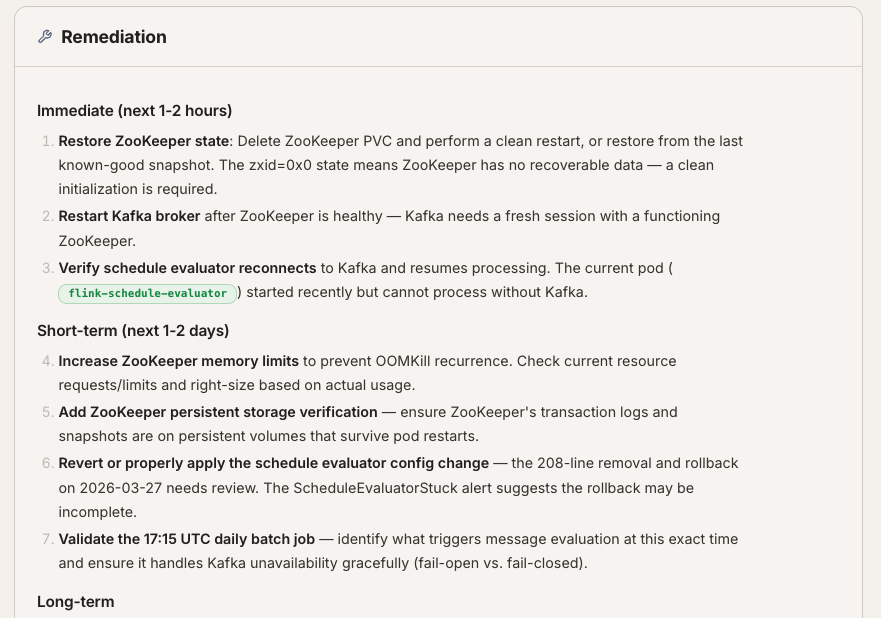
Remediation
Section titled “Remediation”The Remediation section lists concrete actions the agent recommends to resolve the issue. Actions are organized by priority into Immediate, Short-term, and Long-term categories. Each action includes a description of what to do, the reason it matters, and how to verify success. Address the immediate items first, then work through short-term and long-term improvements.
Evidence and Sources
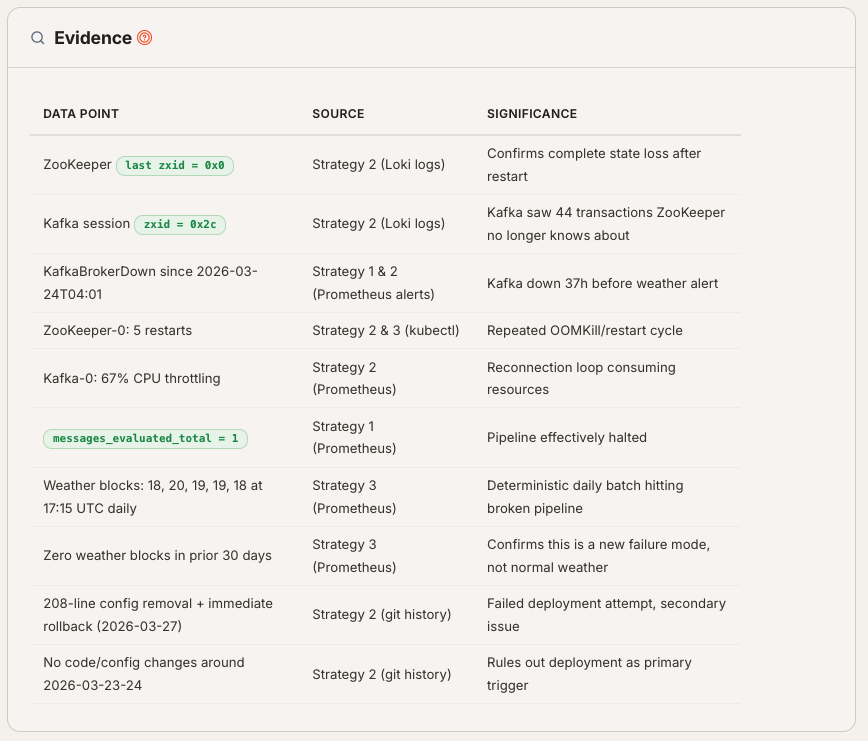
Section titled “Evidence and Sources”The Evidence section presents the raw data points the agent used to reach its conclusions in a table with three columns:
- Data Point — what was observed (e.g., a CloudWatch alarm, a slow query log entry, a Grafana metric).
- Source — where the data came from (e.g., AWS CloudWatch, PagerDuty, Datadog APM).
- Significance — why this data point matters to the investigation.
The Blind Spots subsection flags areas the agent could not fully investigate due to missing data sources or permissions gaps. Check these manually to ensure nothing was missed.
Additional Details
Section titled “Additional Details”Below the main sections, an Additional Details card may appear containing supplementary information such as:
- Impact — a narrative assessment of the incident’s operational and business impact.
- Confidence Assessment — the agent’s reasoning about why its confidence level is what it is, including which evidence strengthened or weakened its conclusions.
Problem Description
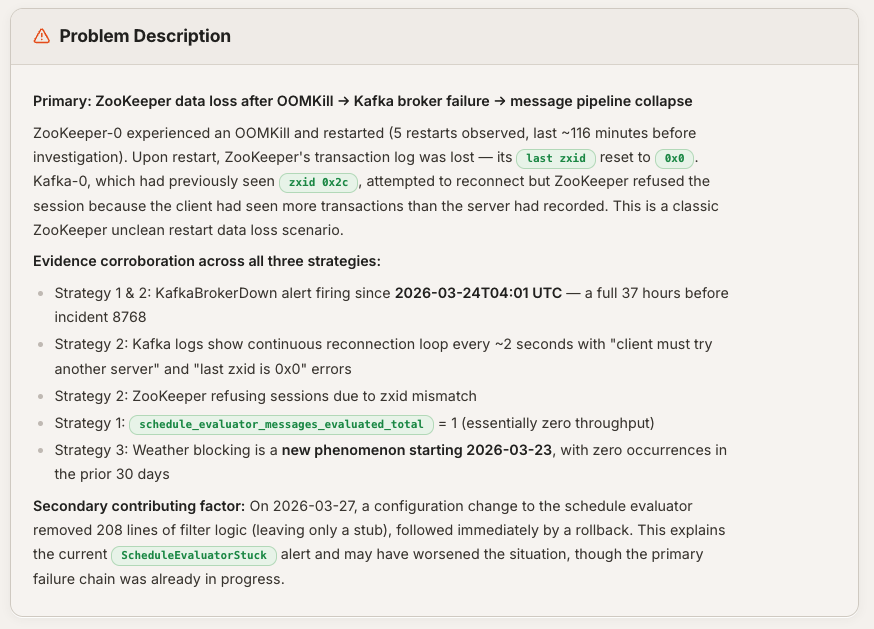
Section titled “Problem Description”The Problem Description section provides a narrative of what happened, drawing on evidence gathered during the investigation. It typically includes a summary of the incident, bullet points highlighting key observations, and may contain code snippets or configuration excerpts that illustrate the root cause.
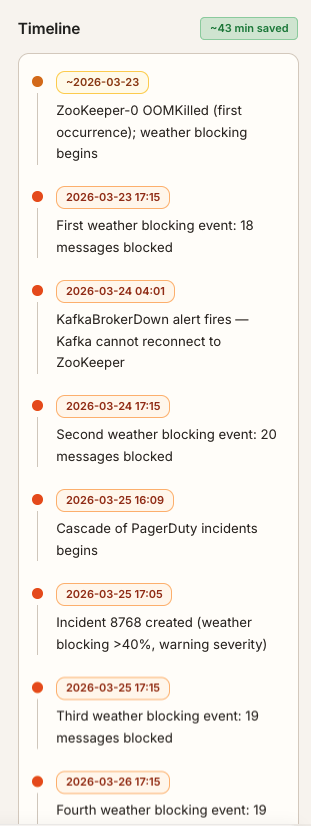
Timeline Sidebar
Section titled “Timeline Sidebar”The right sidebar shows a Timeline of chronological events related to the investigation. Each entry has a timestamp and a description of what occurred. A green badge at the top shows the total time saved. The sidebar is resizable — drag its left edge to adjust the width.