

Investigation Runbook
Overview
Section titled “Overview”The Runbook view shows the agent’s investigation as it happens, step by step. You can watch tool calls execute in real time, see the agent’s reasoning at each stage, and review the full trace of data gathered. Once the investigation completes, the runbook becomes a permanent audit trail of everything the agent did.
An On this page navigation panel on the left lists all prompts and rounds, letting you jump to any point in the investigation. A search filter at the top of the nav panel helps you find specific steps quickly.
Step Execution
Section titled “Step Execution”Each investigation step has a status indicator:
- Done — completed successfully, shown with a checkmark.
- Running — currently in progress, shown with an animated indicator.
- Queued — waiting to execute, shown as dimmed.
Steps execute in sequence within a round. Click any step to expand its details and see the tool input, output, and the agent’s reasoning for that step. Each step shows a friendly tool name, an output preview, and timing information.
Tool Calls
Section titled “Tool Calls”Tool calls are the individual actions the agent takes during a step, such as querying Prometheus, running a kubectl command, calling a PagerDuty API, or searching a service graph. Each tool call shows:
- The tool name in a human-readable format (e.g., “CloudWatch Metrics” instead of
aws_cloudwatch_get_metric_data). - A result preview summarizing the output.
- The status of the call (success or failure).
Expand a tool call to see the full raw output and verify the data the agent used in its analysis.
Rounds
Section titled “Rounds”An investigation can span multiple rounds. Each round is a cycle where the agent gathers data, reasons about it, and decides what to do next. The round header shows:
- The round number and its objective.
- The agent’s confidence level for that round.
- A finding summary of what the round discovered.
Follow-up questions you ask in the prompt bar start new rounds, continuing the investigation with additional context. The left navigation panel groups rounds under their parent prompt so you can see the full conversation flow.
Following Progress
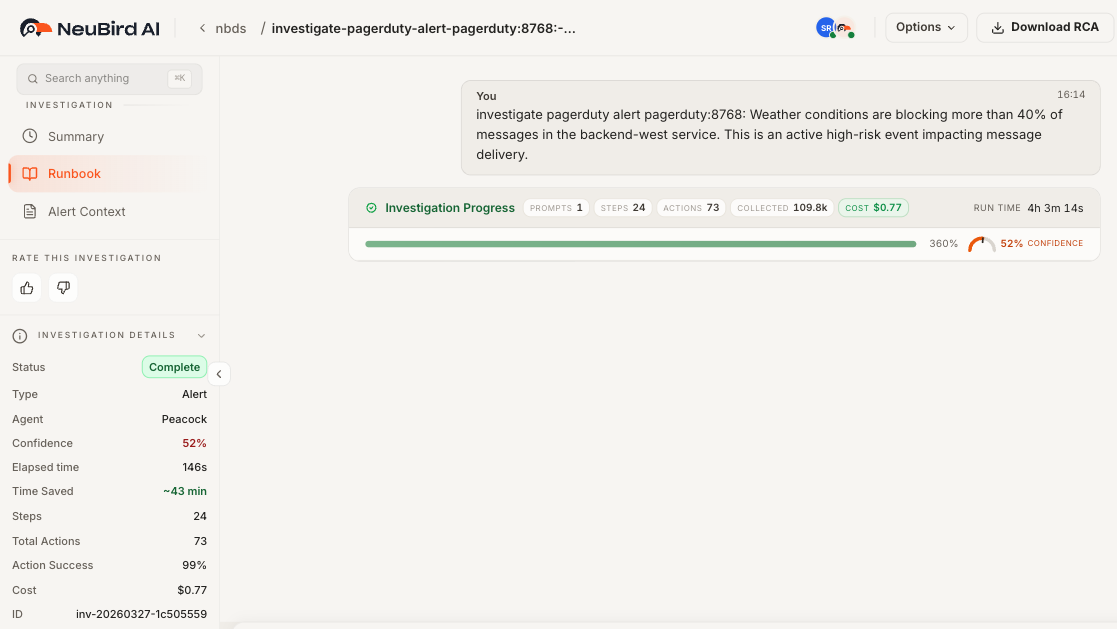
Section titled “Following Progress”While the investigation is running, the runbook auto-scrolls to show the latest activity. A progress header at the top displays:
- The current phase (exploring, gathering context, investigating, or wrapping up).
- Overall completion percentage as a progress bar.
- Elapsed time since the investigation started.
- Confidence level updated in real time.
Once the investigation finishes, a completion summary bar appears at the top with the final confidence score, total tool calls, time saved, and elapsed time. This bar remains sticky as you scroll through the runbook.
Visualizations
Section titled “Visualizations”When the agent produces charts or graphs during the investigation (such as metric trends, error rate distributions, or latency histograms), they appear inline within the runbook as interactive visualization cards. These charts are rendered using the data the agent collected and help illustrate findings visually.