

Investigations
Overview
Section titled “Overview”The Investigations page shows every investigation the NeuBird agent has run for your project. Each investigation is an AI-driven analysis of an alert, question, or task, complete with a status, confidence score, and time-saved estimate. Use this page to review past investigations, track running ones, and drill into root cause analysis details.
Viewing Investigations
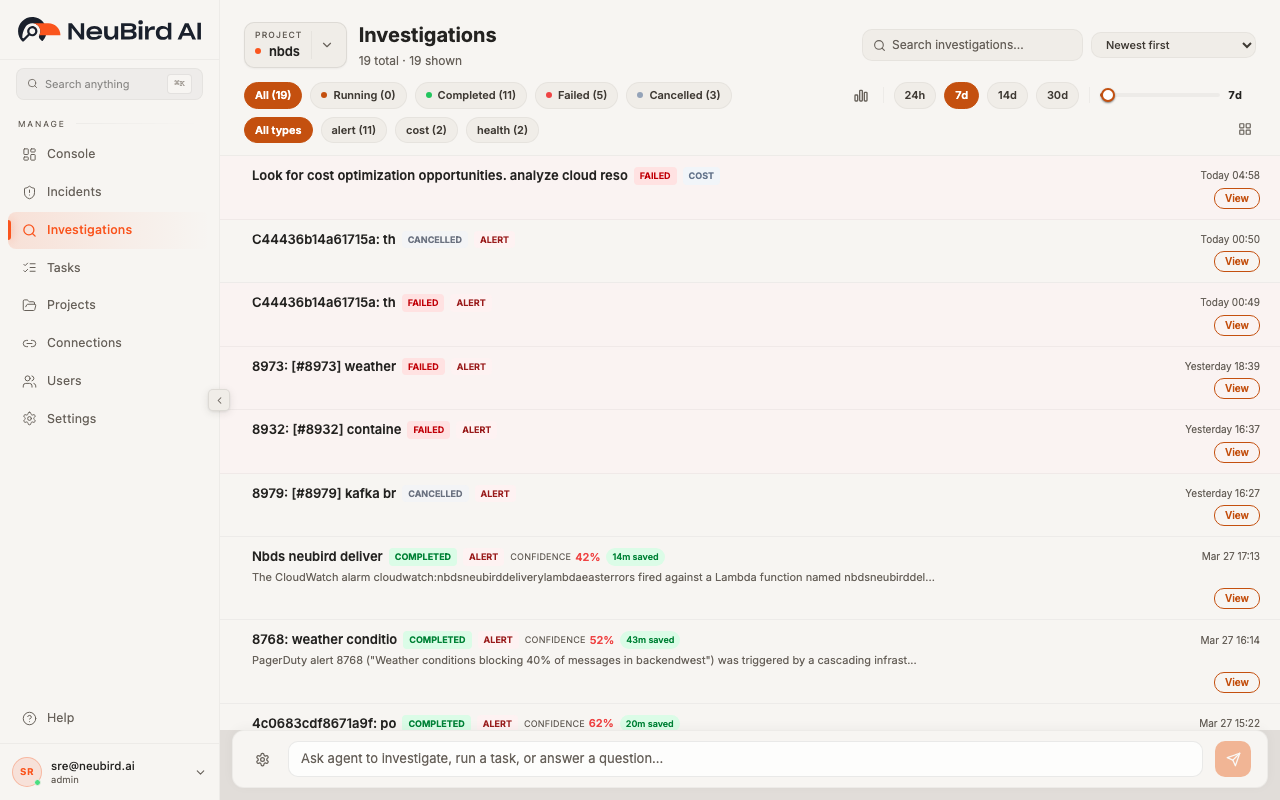
Section titled “Viewing Investigations”Investigations are displayed as a scrollable list. Each row shows:
- Title — a human-readable summary of what was investigated. Slugified alert names are automatically cleaned up for readability.
- Status badge — one of Running (orange, pulsing dot), Completed (green), Failed (red), or Cancelled (gray).
- Type badge — the investigation trigger: Alert, Cluster, Question, Service, or Task.
- Confidence — a color-coded percentage indicating the agent’s confidence in its findings (green for 90%+, yellow for 80-89%, red below 80%).
- Time saved — estimated minutes or hours saved by the automated investigation.
- Timestamp — when the investigation was created, shown as an absolute date and time (e.g., “Today 04:58”, “Mar 27 17:13”).
- Snippet — for completed investigations, a brief excerpt from the analysis summary appears below the title.
Running investigations are highlighted with an orange left border. Failed investigations have a subtle red background tint.
Click any row to open its detail panel on the right side of the page. Click the View button on a row to navigate to the full investigation report.
Filtering and Search
Section titled “Filtering and Search”You can narrow the investigation list using several controls at the top of the page.
Status Filter
Section titled “Status Filter”The status pills across the top filter by investigation state. Click a pill to show only investigations with that status:
- All — shows every investigation (default)
- Running — investigations currently in progress
- Completed — finished investigations with results
- Failed — investigations that encountered an error
- Cancelled — investigations that were stopped before completion
Each pill shows a count of matching investigations. Click an active pill again to deselect it.
Type Filter
Section titled “Type Filter”Below the status pills, type pills let you filter by investigation trigger. These appear when your project has investigations of more than one type (e.g., alert, cost, health). Each pill shows its count. Click All types to remove the type filter.
Search
Section titled “Search”The Search investigations field in the top-right corner filters the list by title, prompt, investigation ID, type, or mode. Type any keyword to instantly narrow the results. Click the X icon to clear the search.
Sort Order
Section titled “Sort Order”Use the sort dropdown next to the search field to change the list order:
- Newest first (default) — most recent investigations at the top
- Oldest first — chronological order
- Status — groups by status (Running, then Completed, Failed, Cancelled)
- Duration: Long to Short — longest investigations first
Time Range
Section titled “Time Range”The time range controls on the right side of the filter bar limit which investigations appear:
- Preset buttons — click 24h, 7d, 14d, or 30d to jump to a common lookback window. The default is 7 days.
- Slider — drag the slider to fine-tune the time range between the minimum and maximum for the current mode (hours or days).
- Histogram — click the bar-chart icon to open a timeline histogram. You can select a custom time range by clicking a bar or dragging across the chart. The selected range appears as a labeled chip that you can dismiss to return to the default.
When any filters are active, a Clear all link appears next to the status pills. Click it to reset every filter and return to the default 7-day view.
Column Visibility
Section titled “Column Visibility”Click the grid icon (bottom-right of the filter bar) to open the column picker. Toggle which badges appear on each investigation row:
- Type — show or hide the type badge
- Mode — show or hide the investigation mode (Advanced, Basic, General, Falcon)
- Metrics — show or hide rounds and duration
- Confidence — show or hide the confidence score
Investigation Detail
Section titled “Investigation Detail”Click any investigation row to open the detail panel on the right side of the page. The list narrows to make room for the panel, which shows the full investigation report including:
- Status, type, mode, and confidence metadata
- Timestamp and duration
- Collapsible sections with the agent’s analysis, root cause findings, and recommendations
- Markdown-formatted content with code blocks, lists, and tables
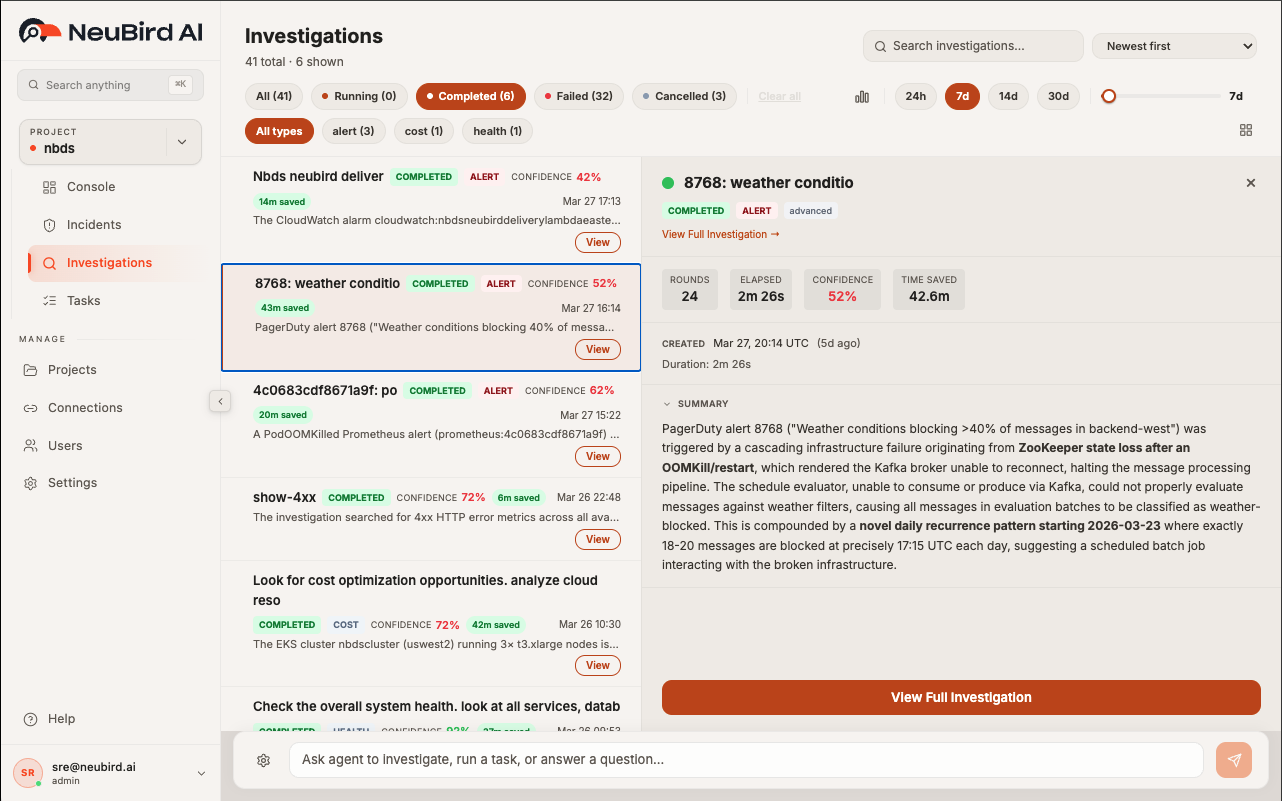
You can close the detail panel by pressing Escape or by clicking away. To open the full-page investigation view with complete formatting and navigation, click the View button on any investigation row.